
Computing the UTM coordinates
How do you compare the measurement you made by pacing in the field to the GPS coordinates or to a map of the real world? Fear not, you only need to do a little trigonometry.
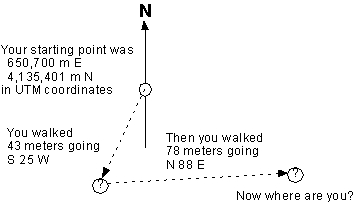
- First, on a blank sheet of paper, sketch out the survey that you completed while looking at your numbers and the map. That is, draw the first station location, and then draw the approximate location of the next station by looking at the bearing (N or S, E or W) and the distance. Do this rough sketch to know what you will be aiming for in your final plot and to double-check your field notes. This will allow you to determine if what you calculate looks correct.
- After your sketch, do the trig. I outline one way below, but you can develop your own procedure if you like, but I have to be able to see how you did it (you can’t just turn in the “answer.”)
Calculating the UTM coordinates in Excel
- We will all start with practice data on this Excel workbook
- You must compute the change in x and y coordinates from the bearing and distance
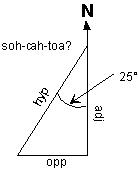
Do you remember your trig?
You can calculate the change of east or north (positive or negative), but it is different in each quadrant of the compass.
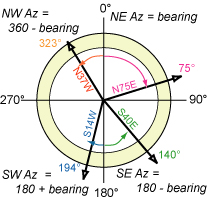
- Calculate the change of east and north
to get the change in easting:
sin(25°)=opp/hyp, but in azimuth, we use 0-360°
to get the proper direction from North, so…..
opp=sin(205°) x hyp
or
opp= -0.422 x 42.9
= -18.1 m
(note the negative indicates farther west)
637,200 – 18.1 = 637,181.9mEto get the change in northing:
cos(25°)=adj/hyp
so…..
adj=cos(205°) x hyp
or
adj= -0.906 x 42.9
= -38.9 m
(note the negative indicates farther south)
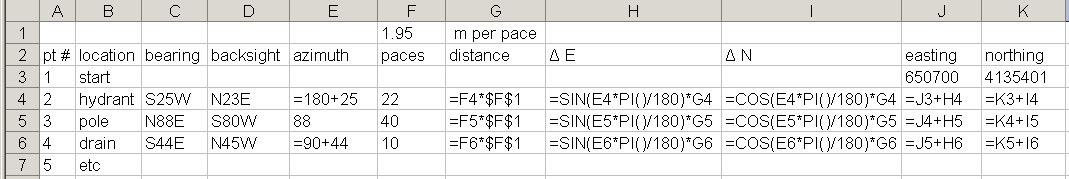
4,183,526 – 38.9 = 4,183,487.1mN - Now the next point is calculated as a change from the previous. Use a spreadsheet to compute these values (Excel here, you’re free to use others like open office or google docs). Here’s how mine looks.
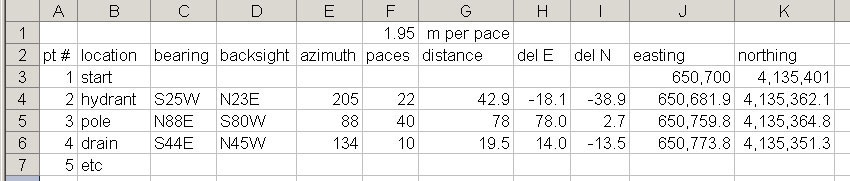
This one shows the equations behind the numbers

- Mind the details!!
- convert all bearing measurements to azimuth (0-360) angles (in the practice data sheet, insert a new column by right clicking on the E and choosing insert column) so that the change in easting or northing will be correctly positive or negative
- to use trig functions in a spreadsheet, you must convert the angles from degrees to radians (2 pi radians in 360 degrees)
- the formula “=PI()” returns the value of Pi (3.1415…), and is used in the SIN and COS function arguments
- Formulas in Column G use a fixed reference in place of the relative cell reference. The “$” in front of a row number or column letter means that it won’t shift copying the equations from cell to cell.
- convert all bearing measurements to azimuth (0-360) angles (in the practice data sheet, insert a new column by right clicking on the E and choosing insert column) so that the change in easting or northing will be correctly positive or negative
Plotting your traverse (and GPS points) in Excel
- In excel make a scatter plot (with lines in between) of the easting and northing calculated from the pace and compass and the easting and northing from the GPS to make sure that these points look like the survey you conducted.

- To plot the PACE and GPS on one graph, use the CHART menu, Source Data…. option to add a new series (select the name, x, and y by clicking on the appropriate cells on the calculation sheet).
- Save your spreadsheet to a thumb drive or box, so you’ll be able to turn it in later.
- NOTE: if your pace and compass traverse is CLEARLY WRONG, simply copy the entire worksheet to a new tab, label it as “corrected data” and try to fix it. Use the backsights to correct bad foresights, or replace one of the bad numbers with a better one. Plot both the original and the corrected data, clearly labeling which data point(s) have been altered. Making mistakes is normal. Determining the error and dealing with it is worth the effort.