Mapping in ArcGIS
Plotting your points on an Air Photo
- To complete this part of the lab, you’ll need to be on a campus computer with ArcMap installed. Parmly 302 is open much of the day and all evening. The Earth and Environmental Geoscience computer lab also has it.
- Make a folder on your desktop called “GIS” and copy your Excel file with your data into that folder.
- Download this ArcMap document from box to that folder and open it. Resave (Save As) it with your last name at the start of the ArcMap document name.
- You’ll see the map in a “Layout View” or you can switch to the “Map View” to have the map fill the full screen.

- Tools for changing the Map View look like this (the blue “back” arrow returns to the previous view or zoom). Scrolling also works. The toolbar may be in a different place on your screen.

- The tools for moving around the Layout View look like this (and may be somewhere else on your page, or if it is missing, look for the “Customize” menu, choose “Toolbars” and check the box by “Layout”)

- Tools for adding text, etc to the Layout View are in the “Drawing” toolbar. If the toolbar is missing, look for the “Customize” menu, choose “Toolbars” and check the box by “Drawing”)

- Make sure that the tab in your Excel file is set up the way the ArcMap needs it.
- In the Excel tab called “export2GIS” make two columns for pacing and two for GPS, one for a description, and one for the point number. Type an “=” and then click on the top cell of the column where you calculated the numbers to get them onto the page.

- Make sure the column headers are in the first row and the column header for the coordinates says something like “pace_east”,”GPS_north”, etc (first row = one word, no spaces but underscores are ok, column names can’t start with numbers).
- Save your Excel file.
- Import these data into the ArcMap window.
- Add the excel table to the “table of contents” using File/Add Data or click the yellow “add data” button.

Double click the excel file and you can see the tabs within it. Choose your export tab

- Once that’s in the table of contents on the left, right-click on it and “open” it, and then check to make sure all your data are there. If not, see previous steps, and try again, or go to the next step to try a work-around method.
- If that failed (you get an error when you try to open the Excel file), it means that the software isn’t able to talk with Microsoft applications. What a bother (see here if you’re curious). We have to go back to Excel and save the “export2GIS” tab into a different format.
- open your excel file again.
- go to the “export2GIS” tab
- choose “Save As..” and from the File Type box below the name
choose “CSV (Comma delimited) (*.csv)“
- you will get a warning that this only saves on sheet and no equations, yada yada, but ignore that.
- repeat step 9 above but choose the .csv file instead of the excel tab.
- Once that’s in the table of contents on the left, right-click on it and “open” it, and then check to make sure all your data are there. If not, come see me.
- Putting these XY points (in UTM coordinates) on the map.
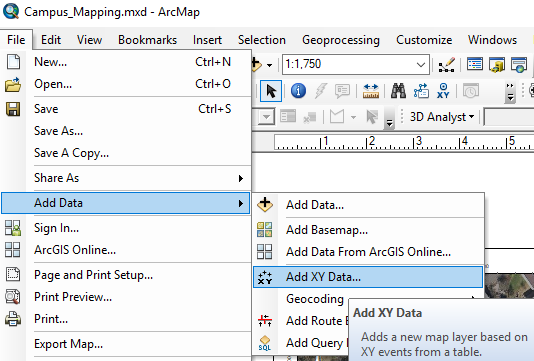
- from the File menu, choose Add Data and Add XY data
- make sure the export tab name is correct, that you select GPS easting or pace easting for “X” and the corresponding northing for the “Y.” If the Coordinate System does not automatically match the map (UTM NAD 1983, zone 17) then find it using the edit button (Choose the folders “Projected Coordinate Systems” / “UTM” / “NAD 1983” and then click on the one called “NAD_1983_UTM_Zone_17N“, or copy the bold words and search for them)

- You can change the way the point is plotted (color, size, shape) to make it more visible. Just double click the symbol in the Table of Contents (TOC).

- repeat the last two steps to add the second two columns of data so you have dots for both pace points and GPS points.
- Save your project. Often!
- Making it useful
- Click on the “list by drawing order” symbol on the Table of Contents, then click once, wait and click again on the names of each of the data layers you added. Give them good names. Make sure the lower symbol is a bit larger than the upper so that you can see them both at the starting position

- You can add annotations like lines to the map using the drawing toolbar and then double clicking it to change the properties (like color and thickness, or adding arrowheads by changing the symbol). If the drawing toolbar can’t be found on your version of ArcMap, click on the Customize menu, then Toolbars, and select “Draw” to load it. Lines will help me follow the path of your pacing.

- Add a legend to the layout view from the “insert” menu (you don’t need to include the Air Photo background image). You can change the properties (like background color) of the legend by double clicking on it once you insert it.
- Add point number or location labels to your pace and/or compass points by right clicking on the layer in the TOC and choose “label features.” If it isn’t using the column you want, right click on the layer again and choose “properties” at the bottom, and then find the “labels” tab to change the column and the size/color of the text.

- Make sure you add your name to the map using the text tool in the drawing toolbar.
- Use File/Export to export the Layout View to a PDF page. The PDF filename should start with your last name (and every file you submit for this course). Do not submit the “.mxd” (ArcMap) file. It is useless without your other data.
- Don’t forget to copy the GIS folder from the desktop to a USB drive or your box account. It will be erased if you leave it on the desktop of a campus computer.
back to lab page