Determining the uncertainty of the GPS points
- How precise are these amazing GPS measurements? When you have many samples at one spot, you can take the average and report it plus the uncertainty of as given by the standard deviation or by the confidence interval. We would report this as, “the average Easting has a value of 464,142.3±1.4 m” and requires us to calculate the standard deviation. When surveyors use a GPS to locate a point, they collect many individual measurements often over a day to determine the average location precisely, often to within millimeters..
- However, if we want to express the confidence range for any individual measurement (for example, the Easting and Northing for one stop on our GPS loop, which we did NOT repeat), we have to rely on our stationary data to find a distance away from the mean that includes some proportion of the individual GPS fixes (say 95%). This is known as a “standard error.” Assuming the GPS data are normally distributed, we look at the variability of the samples (the “standard deviation”) and use the area under a normal distribution curve to evaluate the probability. Because 95% includes almost 2 standard deviations, a 95% standard error for any one sample is ±1.96*(standard deviation).
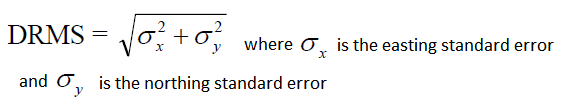
- But hold on, we have both Easting and Northing standard errors. How do we get a single standard error distance? We can use the Distance Root Mean Squared (DRMS), which expresses the 2D variability.
Do the following to determine both the confidence interval of the mean of the position fixes AND the error in the individual measures you took while walking:
1) Open the spreadsheet of the tally of the stationary GPS fixes outside the science center (David should have sent it to you by now…. or put it in the box folder).
2) Calculate the mean of the data for the GPS easting and GPS northing at the stationary GPS.
3) Next calculate the standard deviation of the easting and northing (using an excel function).
4) To answer the question A above, or to determine how precisely average of the stationary GPS is located, calculate the 95% confidence interval for the mean Easting and mean Northing using at an alpha = 0.05 (the Excel function: =CONFIDENCE(alpha,standard_dev,sample size), where the arguments are as listed). Make sure this value is clearly labeled on your excel sheet.
5) To determine the 95% confidence interval of individual measurements, calculate the standard error in each direction as =1.96* (standard deviation of each direction) and then calculate the Distance Root Mean Squared (DRMS).
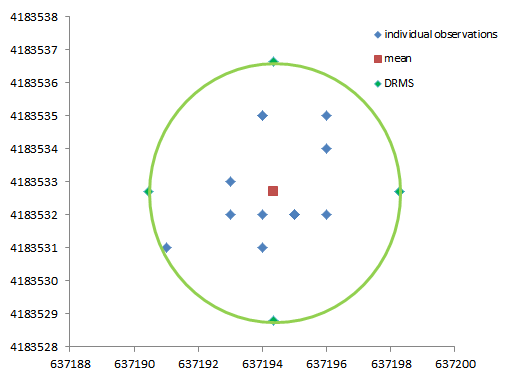
6) Finally make an X-Y scatter plot of all GPS easting vs. GPS northing points as black dots, the mean easting and northing as a larger red square, and confidence interval of the data as a green ellipse centered on the mean (this might take some thought on your part–you can plot the errors east/west and north/south, but you’ll have to draw an ellipse shape that connects these points I think….unless you know the formula for the ellipse…..).
7) Turn in this plot with the rest of your discussion of error (Note you can select and copy the graph, and then paste it into your Word document. HOWEVER, use “paste special” from the edit menu to paste it as a “picture” not as a microsoft excel object. That leads to system errors). It should look something like this (using older data). One or more data points should be near the circle (1 outta 20 is 95% right?).